
Welcome to PPUS
PPUS is an online tool to predict pseudouridine sites recognized by pseudouridine synthase in RNA. Currently, PPUS can predict pseudouridine sites recognized by PUS1, PUS4 and PUS7 in yeast and PUS4 in human. PPUS employed support vector machine as the classifier and used nucleotides around pseudouridine site as feature. We wish PPUS will be a timely and useful tool to the filed.
Reference
[1]Schwartz, S., et al., Transcriptome-wide mapping reveals widespread dynamic-regulated pseudouridylation of ncRNA and mRNA. Cell, 2014. 159(1): p. 148-62.
[2]Carlile, T.M., et al., Pseudouridine profiling reveals regulated mRNA pseudouridylation in yeast and human cells. Nature, 2014. 515(7525): p. 143-6.
[3]Lovejoy, A.F., Riordan, D.P. and Brown, P.O. (2014) Transcriptome-wide mapping of pseudouridines: pseudouridine synthases modify specific mRNAs in S. cerevisiae, PloS one, 9, e110799.
PPUS Tutorial
Post-transcriptional modification of RNA nucleosides occurs in all living organisms. Pseudouridine, is the most abundant modifications. However, except a few well-studied cases, little is known about the pseudouridine positions and their function. Recently, a newly RNA-seq method is developed, which could map pseudouridine position in large scale. And many pseudouridine modifications have been found in mRNA for the first time [ref. 1 and 2]. To facilitate pseudouridine research, we developed PPUS, a web server, aiming to predict pseudouridine sites that recognized by pseudouridine synthase.
Currently, PPUS could accurately predict PUS-specific pseudouridine sites. PUS1, PUS4 and PUS7 in yeast and PUS4 in human is supported. PPUS employed support vector machine as the classifier and used nucleotides around pseudouridine site as feature. The outputs of PPUS are easy to understand, and could be browsed online or downloaded for further study. Detailed information on how to use PPUS and how to understand the output is as following:
1. Visiting PPUS:
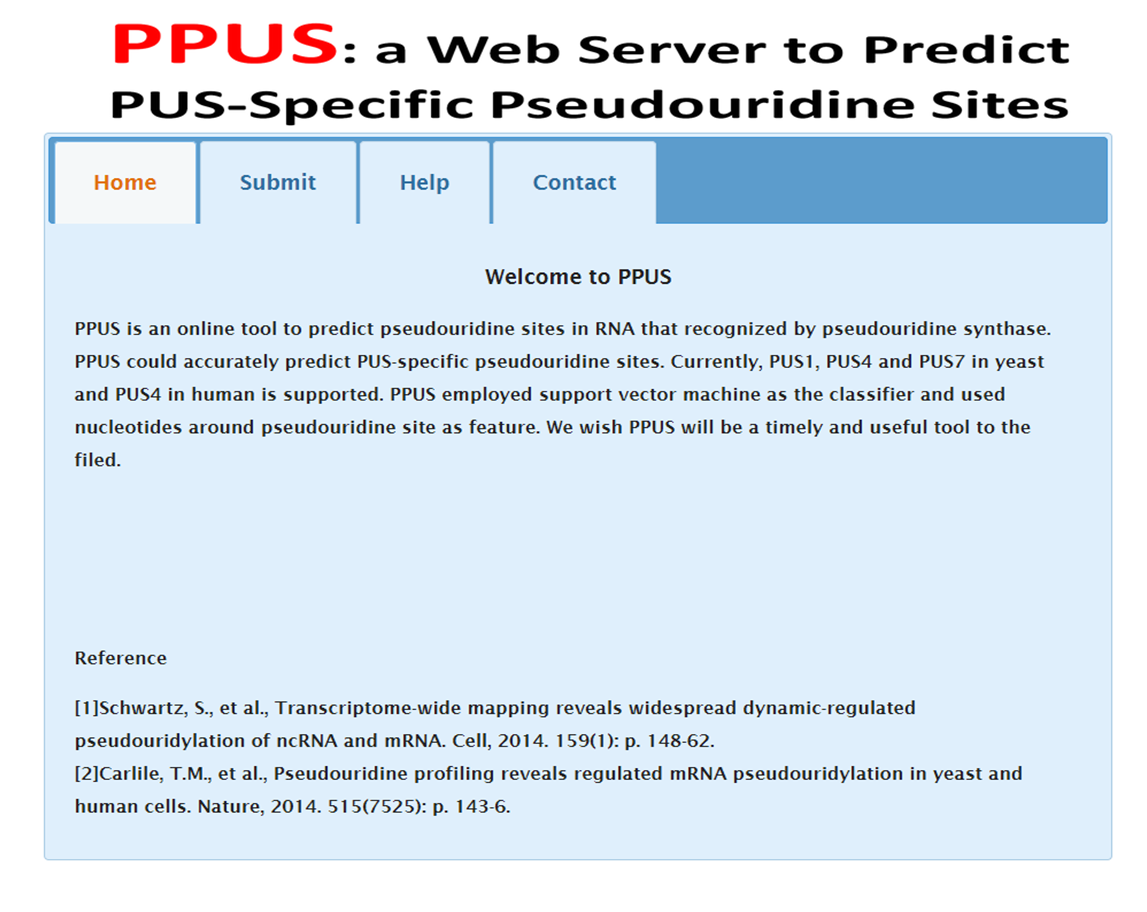
Log on PPUS at http://soft.pkmu.cn/ppus/, as shown in Figure 1.
2. Submit.
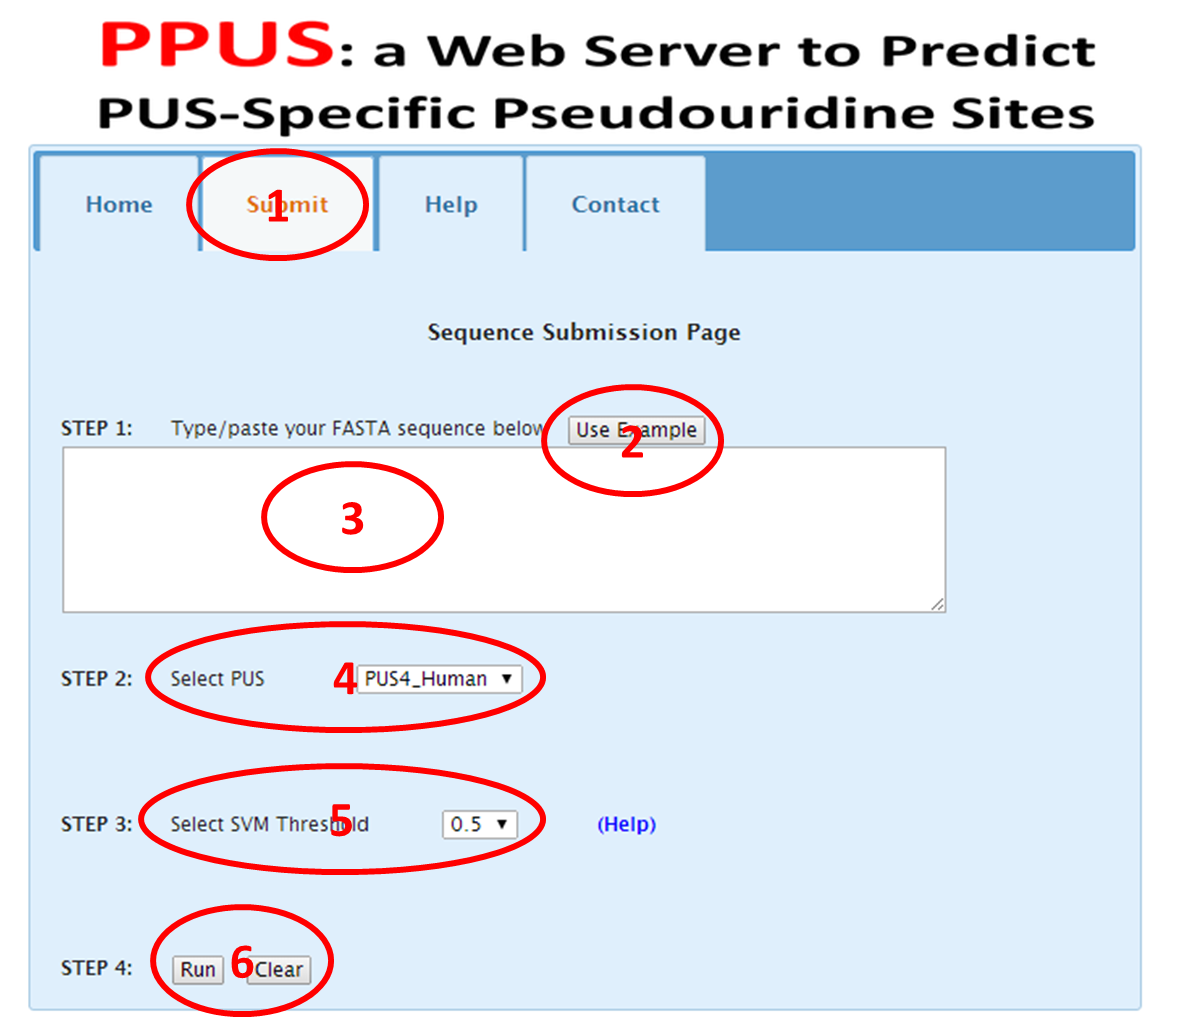
2.1 Click the menu "submit" (red "1" in Figure 2).
2.2 Type/paste your FASTA sequence (red "3" in Figure 2). An example is provided by just clicking the example button (red "2" in Figure 2).
2.3 Choose the pseudouridine synthases that you want to analyze (red "4" in Figure 2). Currently, PUS1, PUS4,PUS7 and All are supported for Yeast, while only PUS4 is supported for Human. When all is selected for Yeast, it performed like selecting PUS1,PUS4 and PUS7 simultaneously in Yeast
2.4 Choose the SVM threshold (red "5" in Figure 2). For each site predicted by SVM, it outputs a proability(0-1) to describe how reliable the prediction. As we only care the positive prediciton, so the probabilty can be any that higher than 0.5. The higher the probability, the more reliable the prediction. To make it easy to display in the web page, we convert the proability to M-score by equation: M-score=floor(10*probability). The M-score is an integer. We also provide a link (Help)to give an explaination on this.
2.5 Click button "Run" to submit request to PPUS, or click "Clear" to clear all sequences (red "6" in Figure 2). The result will be shown in a new page.
3. Interpretating outputs of PPUS.
3.1. Currently, PPUS can predict sites modifed by three pseudouridine synthases for yeast: PUS1, PUS4 and PUS7, and one synthase for Human: PUS4. These can be chosen in the submenu list(red "4" in Figure 2). Besides, we also provide an choice named "All_Yeast". When user select this submenu, for each yeast gene, there are five rows to show the results: "Sequence", "Marker" and "PUS1","PUS4" and "PUS7"(red "2" in Figure 3). In row "Sequence", the nucleotide, predicted to be a pseudouridine site, is highlighted in blue color, a * at corresponding position in row "Marker". In each row of "PUS1","PUS4" and "PUS7"(red "3" in Figure 3), a M-score is given if the score higher than the threshold(red "5" in Figure 2) selected by user. The higher the M-score, the more likely the prediction is correct. The M-score is computed by M-score=floor (10*probability). The probability is outputed by Libsvm. More details about Libsvm can be found at web site: http://www.csie.ntu.edu.tw/~cjlin/libsvm/.
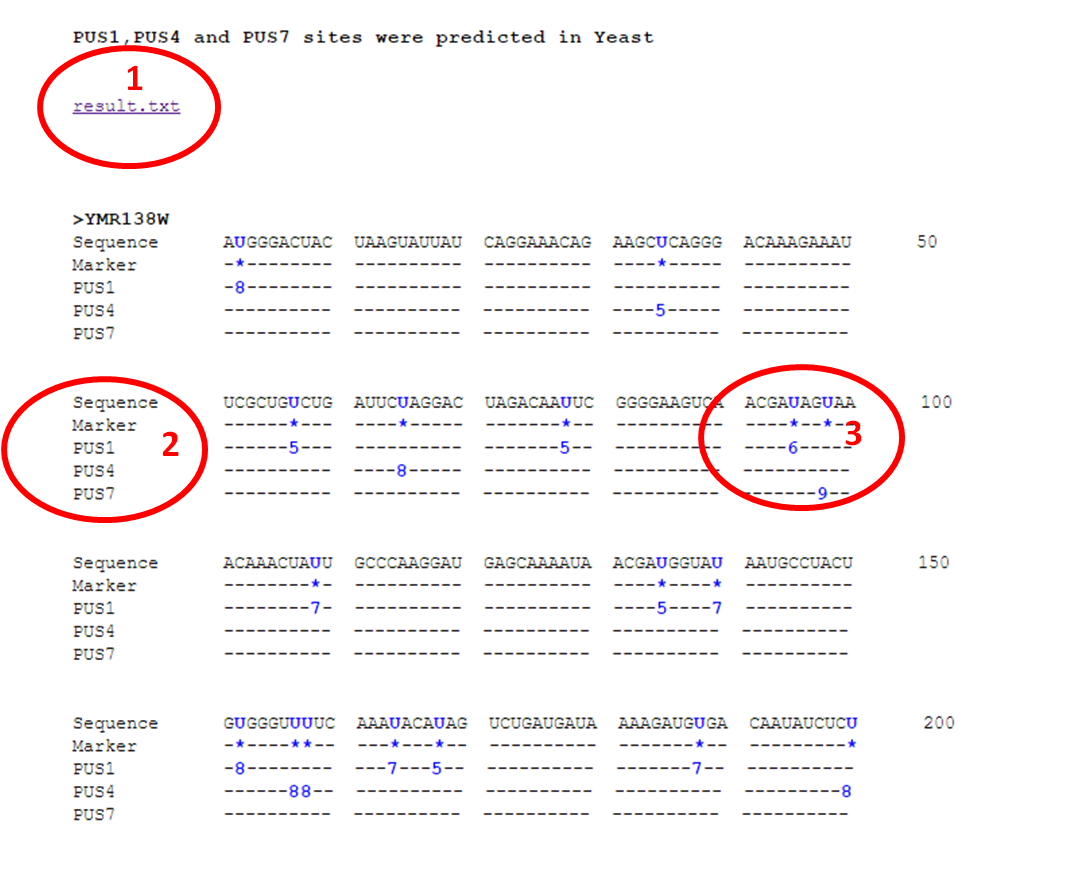
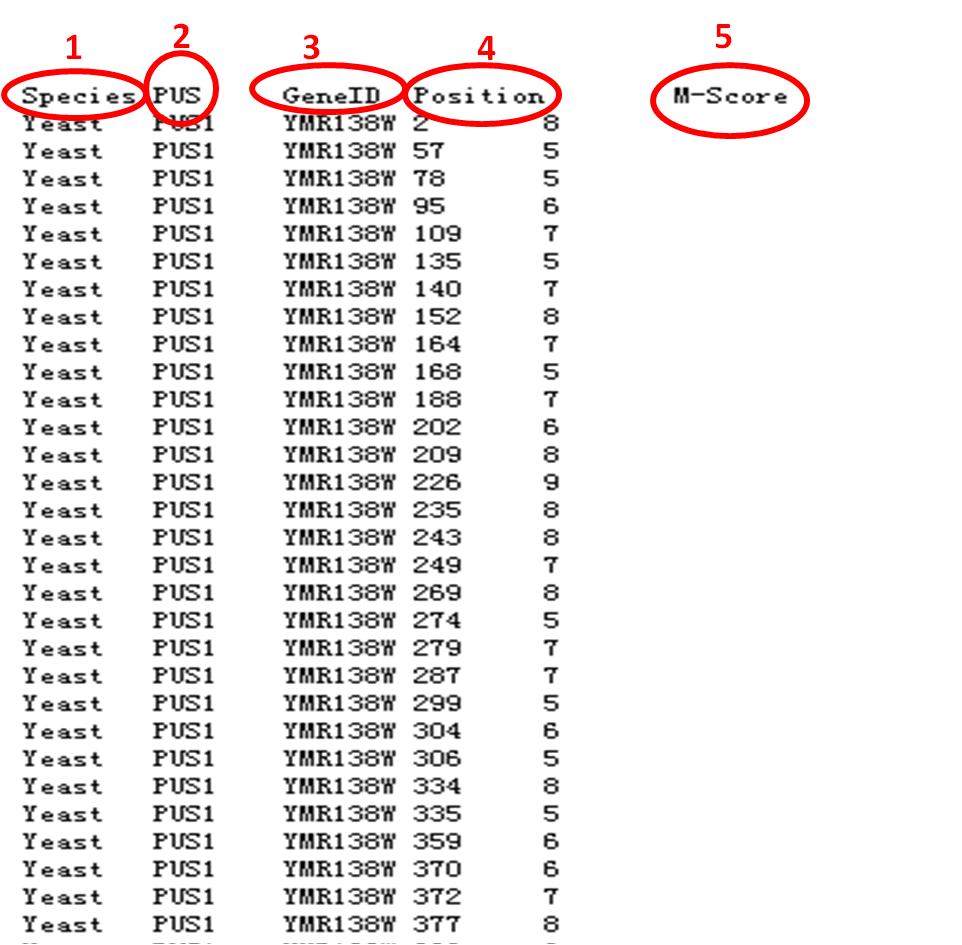
3.2. Downloadable result. The downloadable "result.txt" can be found in red "1" in Figure 3. It can also be open in browser, as show in Figure 4. There are five columns, the first column is species,(red "1" in Figure 4) the second is pseudouridine synthase(red "2" in Figure 4), the third is Gene identifier(red "3" in Figure 4), the fourth is the position in sequence (red "4" in Figure 4), and the fifth is M-score (red "5" in Figure 4).
4. Reference
[1] Schwartz, S., et al., Transcriptome-wide mapping reveals widespread dynamic-regulated pseudouridylation of ncRNA and mRNA. Cell, 2014. 159(1): p. 148-62.
[2] Carlile, T.M., et al., Pseudouridine profiling reveals regulated mRNA pseudouridylation in yeast and human cells. Nature, 2014. 515(7525): p. 143-6.
[3] Wasserman, W.W. and A. Sandelin, Applied bioinformatics for the identification of regulatory elements. Nat Rev Genet, 2004. 5(4): p. 276-87.
-
Feel free to contact:
Dr. Yan-Hui Li
Institute of Cardiovascular Sciences, Peking University Health Science Center
38 Xueyuan Rd, Beijing 100191 China
Email: liyanhui@hsc.pku.edu.cn
Dr. Qinghua Cui
Department of Biomedical Informatics, Peking University Health Science Center
38 Xueyuan Rd, Beijing 100191 China
Email: cuiqinghua@hsc.pku.edu.cn